Science infographics
Science is easier to remember when you can see how a process unfolds. These infographics break big ideas such as photosynthesis, digestion, the water cycle and how vaccines train the immune system into a handful of clear, ordered steps.
Each graphic is written in plain language for readers aged about 13 and up, and it lines up well with what students meet in CBSE and other school science courses, without copying any textbook. Every page explains the topic in more depth below the image, answers common questions and lists the sources we checked, from encyclopaedias to public-health agencies.
Teachers can print the free A4 PDF for a notice board, drop the PNG into slides, or embed the graphic on a class blog with the credit line built in. Students can use them for quick revision before a test, or to check that they have the sequence of a process right.
All Science infographics (4)
 Science
How Photosynthesis Works: From Sunlight to Sugar
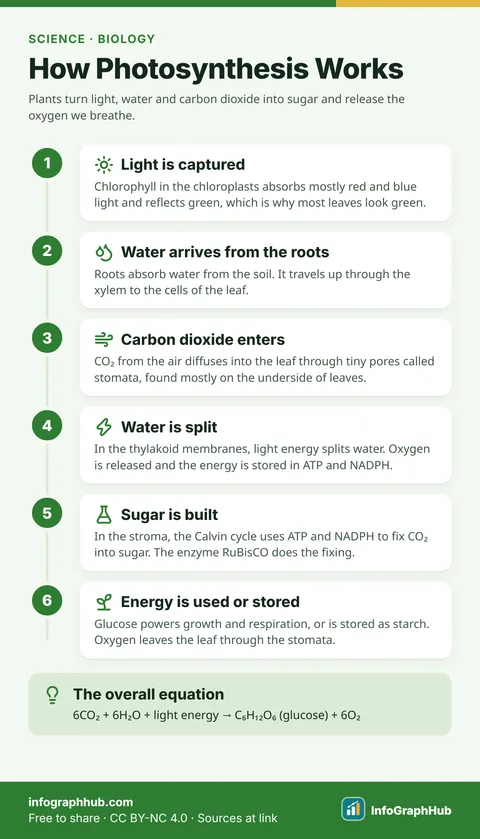
Photosynthesis is how plants use light energy to turn carbon dioxide and water into glucose, releasing oxygen as a by-product. It happens in chloroplasts in two linked stages: the light-dependent reactions and the Calvin cycle.
 Science
How Vaccines Work: Training Your Immune System
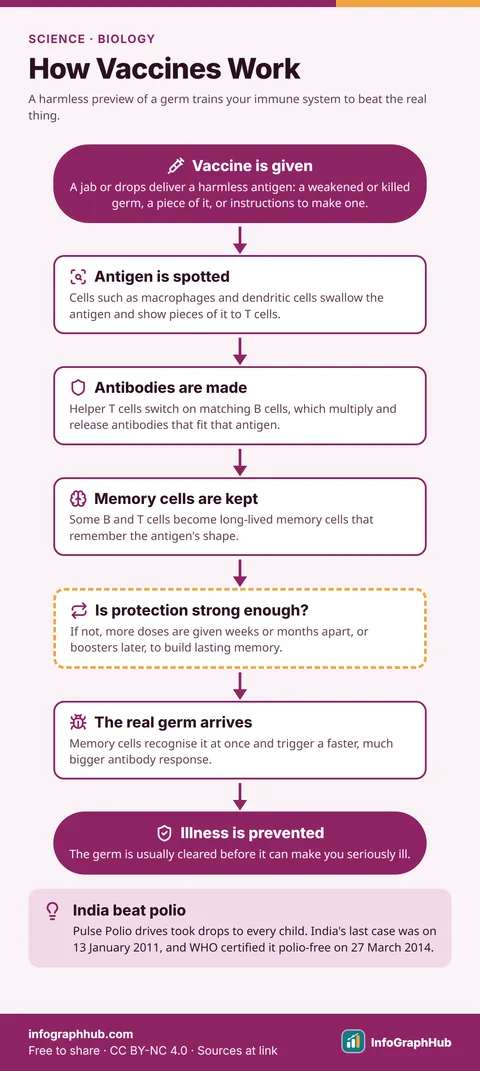
Vaccines work by imitating an infection. They show your immune system a harmless antigen from a germ, so it makes matching antibodies and memory cells that can fight the real germ quickly if it ever arrives.
 Science
The Human Digestive System: How Food Becomes Energy
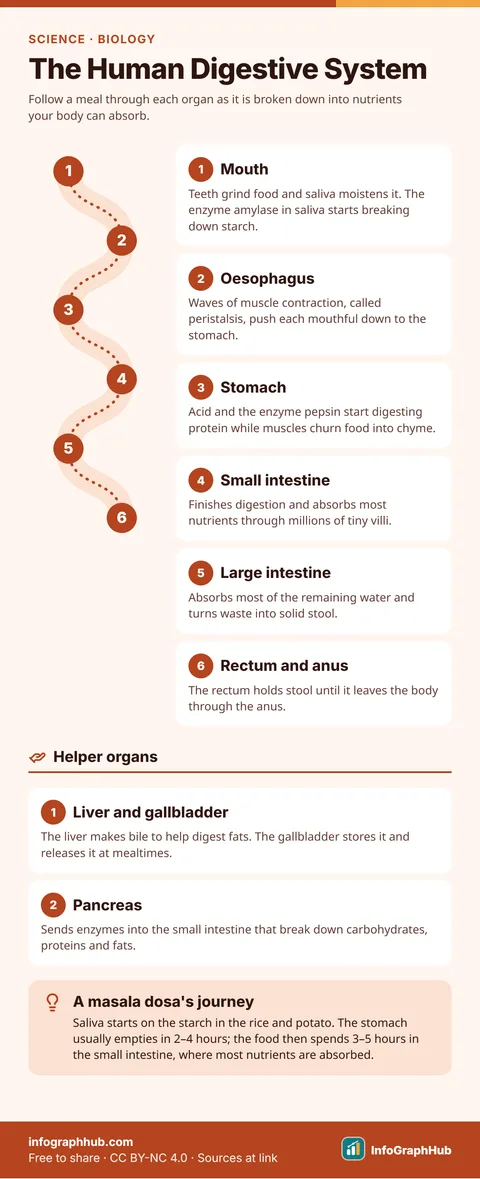
The digestive system breaks food into nutrients small enough to enter the blood. Food passes from the mouth through the oesophagus, stomach and intestines, helped by juices from the liver, gallbladder and pancreas.
 Science
The Water Cycle Explained
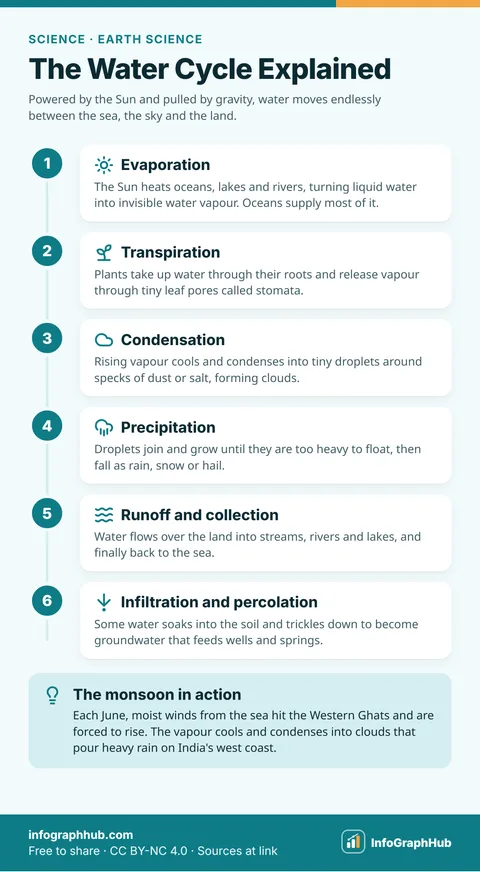
The water cycle is the non-stop movement of water between oceans, air and land. Powered by the Sun, water evaporates, condenses into clouds, falls as rain or snow, and flows or soaks back towards rivers, groundwater and the sea.
Frequently asked questions
Are these science infographics free for school use?
Yes. Every infographic is free to download, print and share in classrooms under the CC BY-NC 4.0 license, as long as you credit InfoGraphHub.
Do the infographics follow the CBSE syllabus?
They cover topics taught in CBSE and other school science courses, written in our own words. Always use your textbook as the main reference for exams.
How do you check the science is correct?
Each graphic is reviewed against at least two reliable sources, such as encyclopaedias or public-health agencies, listed on the page with the date they were checked.