History and geography infographics
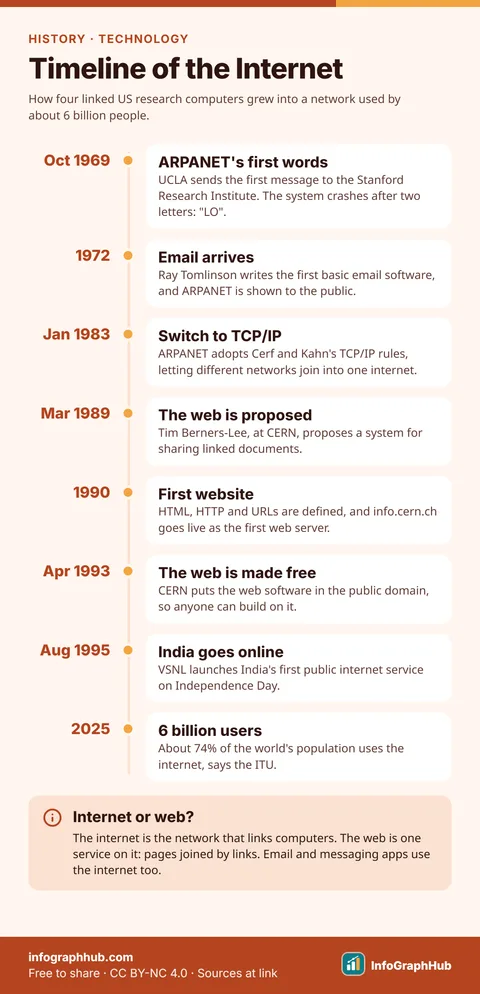
History makes more sense when you can see how events connect. These infographics lay out key developments as timelines and visual summaries, so you can follow cause and effect at a glance, such as how a small research network in the late 1960s grew into the internet billions of people use today.
Every date on a timeline is checked against reliable sources, which are listed under each graphic along with a longer written explanation and answers to common questions. Where historians disagree about a date or a first, the explanation says so rather than picking a side silently.
Use these graphics to introduce a topic in class, to revise for a quiz, or to add context to a project or blog post. They are free to download, print and embed under the CC BY-NC 4.0 license, with credit to InfoGraphHub.
All History & Geography infographics (1)
Frequently asked questions
How are the dates on timelines checked?
Each date is checked against at least two reliable sources, such as encyclopaedias or the organisations involved, which are listed on the page.
Can students use these timelines in projects?
Yes. Credit InfoGraphHub and link to the page, as required by the CC BY-NC 4.0 license.
Will you add more history and geography topics?
Yes. New timelines and explainers are added regularly. Suggest a topic from the Contact page.