Maths infographics
Free maths infographics on fractions, percentages, ratio and more: worked examples, common mistakes and cheat sheets to print or embed.
All Maths infographics (2)
 Maths
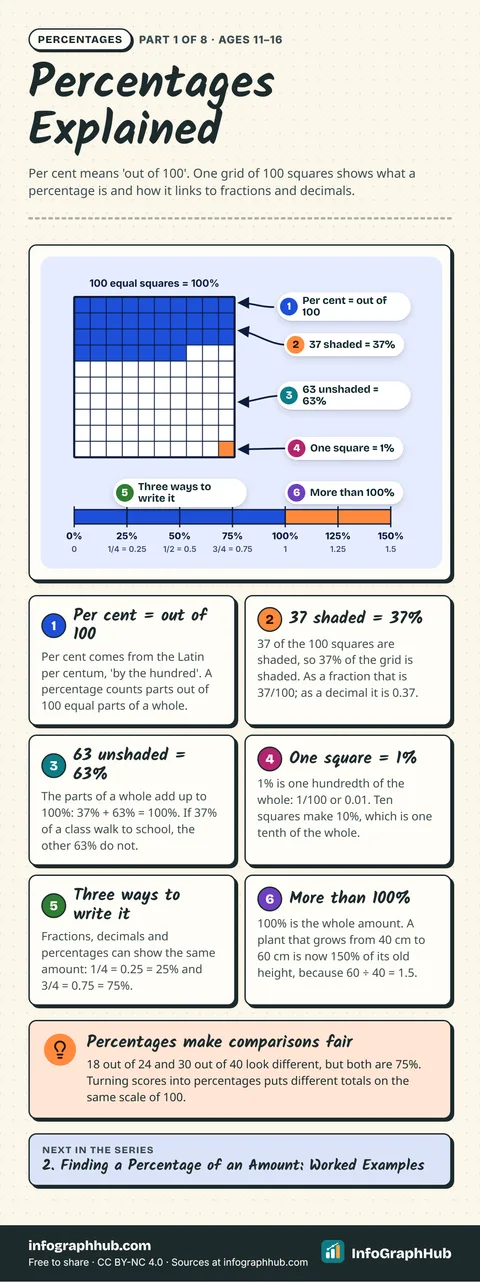
MathsPercentages Explained: What a Percentage Means
What a percentage is, shown on a hundred square: per cent means out of 100, the parts of a whole add up to 100%, 1% is one hundredth, and the same amount can be written as a fraction, a decimal or a percentage, including values above 100%.
 Maths
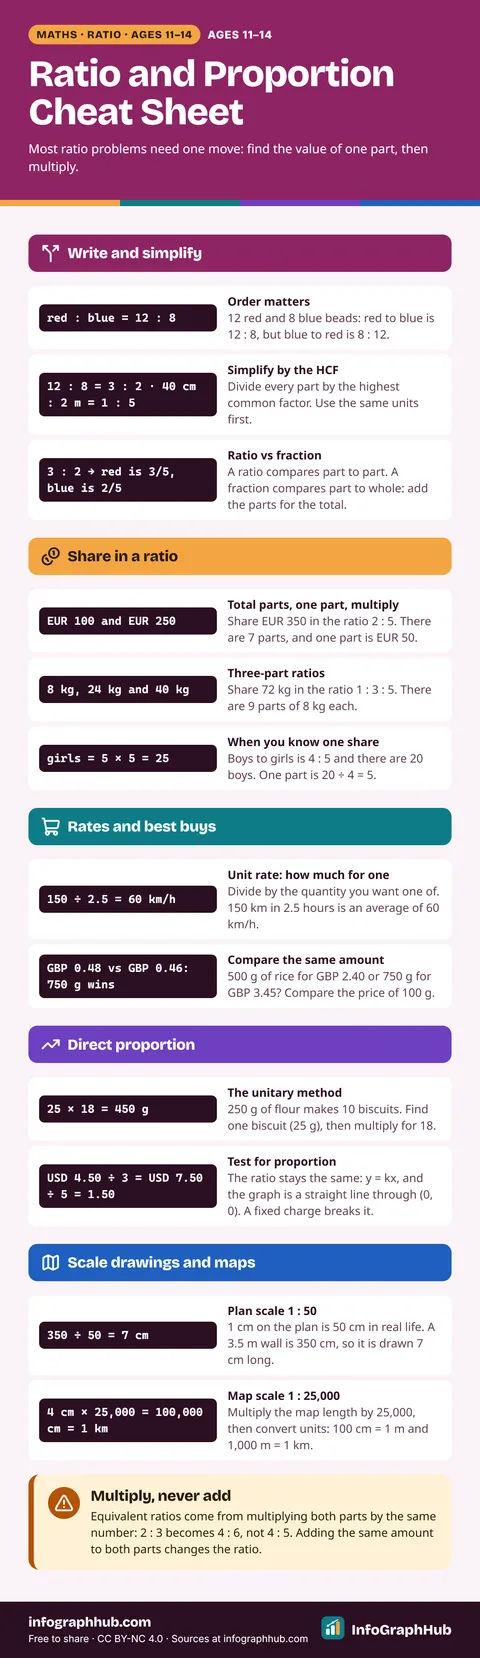
MathsRatio and Proportion: Cheat Sheet with Worked Examples
A one-page ratio and proportion cheat sheet: write and simplify ratios, tell a ratio from a fraction, share an amount in a ratio, use unit rates to find the best buy, solve direct proportion problems and read scales on drawings and maps.
About these maths infographics
Maths makes sense when you can see the method. These infographics show each idea as a short sequence: what it means, the rule, a worked example step by step, and the mistakes that cost marks.
Every graphic is written for learners aged 11 to 16 and their teachers, in plain words, with metric units and examples that work in any country. Topics are mapped to the courses they fit, such as GCSE, IGCSE, the US Common Core and the Australian Curriculum, without copying any specification.
Print the free A4 or US Letter PDF for a classroom wall or revision folder, add the PNG to slides, or embed it on a class blog with the credit line built in. Many topics come as a full series, ending with a quiz to check understanding.
Frequently asked questions
Are these maths infographics free for school use?
Yes. Every infographic is free to download, print and share in classrooms under the CC BY-NC 4.0 license, as long as you credit InfoGraphHub.
Which courses do they fit?
They cover core number, ratio and algebra topics taught in GCSE, IGCSE, US Common Core and other secondary courses. Where a topic fits a course, the page lists it.
Do the infographics show full working?
Yes. Worked-example parts show every step, and common-mistake parts show the wrong working next to the right one so students can spot the slip.